AlterNET Studio Scripting and Debugging Engines
When integrating scripting into .NET applications, choosing the right scripting and debugging engine is crucial for flexibility, performance, and developer productivity.
With AlterNET Scripter, developers can integrate multiple scripting languages - including C#, Visual Basic, Python, and JavaScript/TypeScript - directly into their .NET applications. This allows users to extend application logic, automate workflows, create custom scripting environments similar to Visual Basic for Applications (VBA), and prototype code without needing a full IDE like Visual Studio.
Built on Proven Technologies
AlterNET Scripter leverages several mature scripting and compilation frameworks to provide a robust and consistent development experience across languages:
-
C# and Visual Basic with Microsoft Roslyn - The Roslyn compiler platform enables real-time code compilation and syntax analysis, making it ideal for embedding modern .NET scripting support.
-
Python with IronPython and Python.NET - Both implementations provide flexible Python integration. IronPython offers tight CLR interoperability, while Python.NET allows leveraging native CPython libraries directly from .NET.
-
JavaScript and TypeScript with Microsoft ClearScript - ClearScript integrates Google’s V8 engine, supporting modern JavaScript and TypeScript execution within .NET applications. Combined with the Google Chrome Debugger development tools, developers can debug scripts with the same experience as in web tools.
Each engine provides unique advantages depending on performance requirements, scripting complexity, and desired runtime environment.
Integrated Debugging and Cross-Language Support
Debugging capabilities are a critical part of any embedded scripting system.
The AlterNET Script Debugger delivers a unified, cross-language debugging experience by integrating multiple technologies under one framework. This unified approach enables developers to:
-
Set breakpoints and inspect variables in C#, VB, Python, or JavaScript scripts.
-
Step through scripts directly inside the host application.
-
View call stacks, evaluate expressions, and monitor execution context in real time.
Such integration provides Visual Studio-style debugging for scripts running inside your application, improving developer productivity and enabling advanced customization.
Debugging Engine Limitations and Differences
Each scripting engine in AlterNET Scripter offers unique strengths and limitations shaped by its underlying technology. While all provide comprehensive debugging capabilities, their performance, integration level, and development experience differ depending on the language and framework used.
The table below summarizes the key differences and limitations developers should consider when selecting or integrating a scripting and debugging engines.
| Engine | Debugging Support, Limitations and Differences |
|---|---|
| C# & Visual Basic | Provides full-featured debugging with breakpoints, step-through execution, variable watches, call stacks, and multi-thread support. Offers the most complete and performant integration. However, it has some known limitations for script execution and debugging within the same process. |
| IronPython & Python.NET | Provides seamless script execution and debugging within the same application process. Supports breakpoints, stepping, and variable inspection. Python.NET debugger requires Python to be installed, while IronPython debugger does not support native CPython extensions. |
| JavaScript & TypeScript | Supports similar to Pytnon debuggers set of script debugging features, including breakpoints, step-through execution, and real-time variable inspection. Slower performance compared to Roslyn and Python. |
| Debug Adapter Protocol (DAP) | Enables standardized cross-language debugging through communication between the debugger and language-specific adapters. Requires a compatible external debugger; available features vary depending on the language adapter. |
Below, we explore how each engine works in mode details.
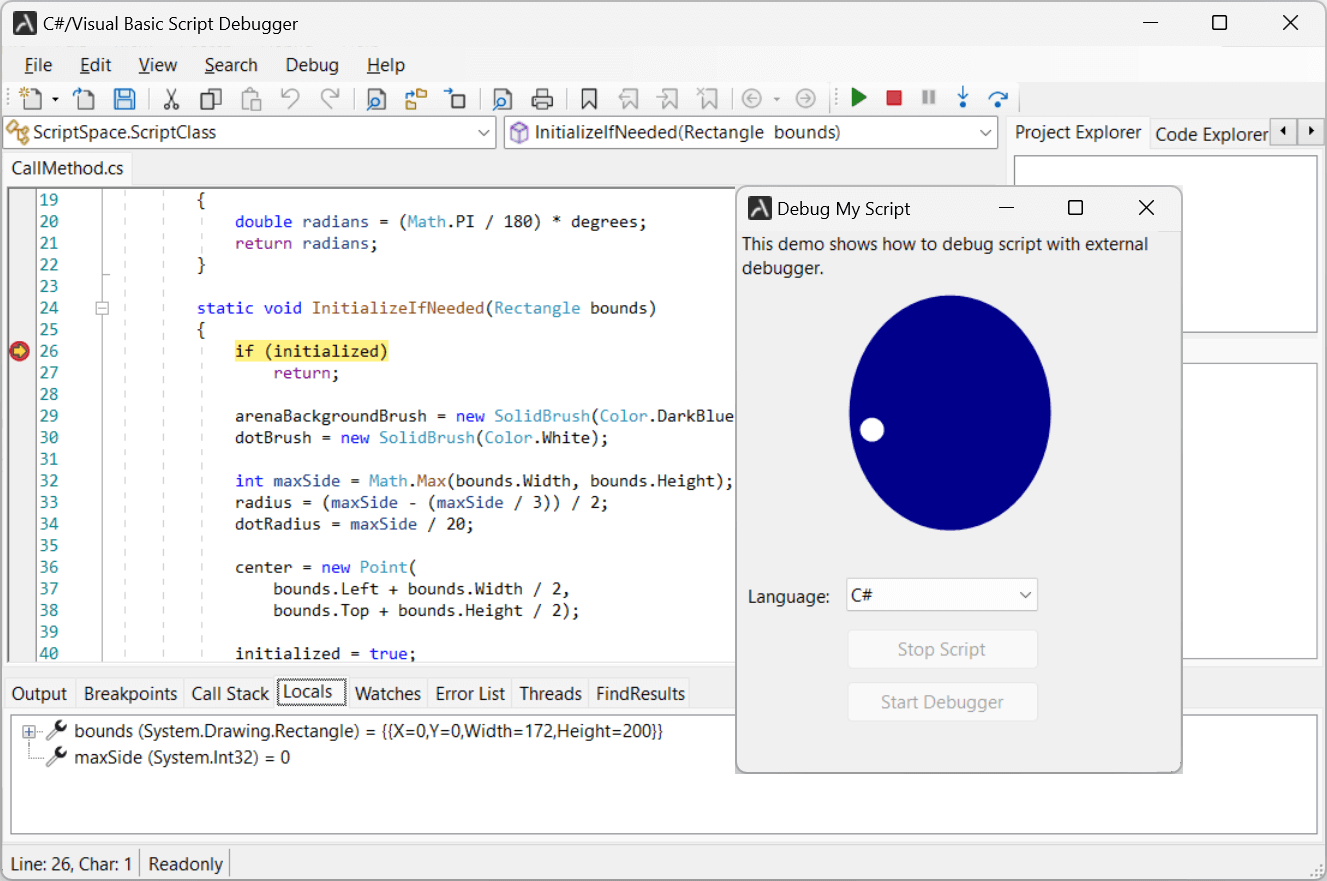
C# and Visual Basic Scripting and Debugging
Our initial and most mature scripting engine enables seamless integration of C# and Visual Basic scripting within .NET applications. It empowers developers and end-users to extend application functionality through dynamic code execution in a controlled runtime environment.
Evolution of AlterNET Scriping Technology
Originally, scripting for C# and VB.NET was implemented using CodeDOM, a technology suited for runtime code generation and compilation. As the ecosystem evolved, we transitioned to the modern Microsoft Code Analysis (Roslyn) APIs, providing advanced syntax analysis, improved performance, and access to the same compilation services used by Visual Studio. These APIs also power our Code Editor, offering syntax highlighting, IntelliSense, and a development experience nearly identical to working in Visual Studio itself.
For more details, see our blog article on C# and VB syntax parsing.
Robust Debugging Architecture
The AlterNET Scripter Debugger for C# and Visual Basic is built on the .NET Framework Command-Line Debugger (mdbg) and utilizes ICorDebug interfaces - the same low-level APIs used by Visual Studio. This ensures reliable support for all essential debugging features:
-
Breakpoints and step-by-step execution
-
Expression evaluation and watch windows
-
Stack traces and multi-threaded debugging
Addressing Known Limitations
Because C#/Visual Basic scripts are compiled into native machine instructions, there are inherent limitations when running and debugging scripts within the same process. To mitigate this, we support two alternative debugging setups:
-
External Debugging Application: Run the debugger as a standalone tool that attaches to your main application’s process, enabling safe and reliable debugging of embedded scripts.
-
Separate Script Executable: Compile and run scripts in a separate process, using inter-process communication (IPC) to interact with application-defined objects.
See our detailed blog article on known debugging limitations in .NET scripting.

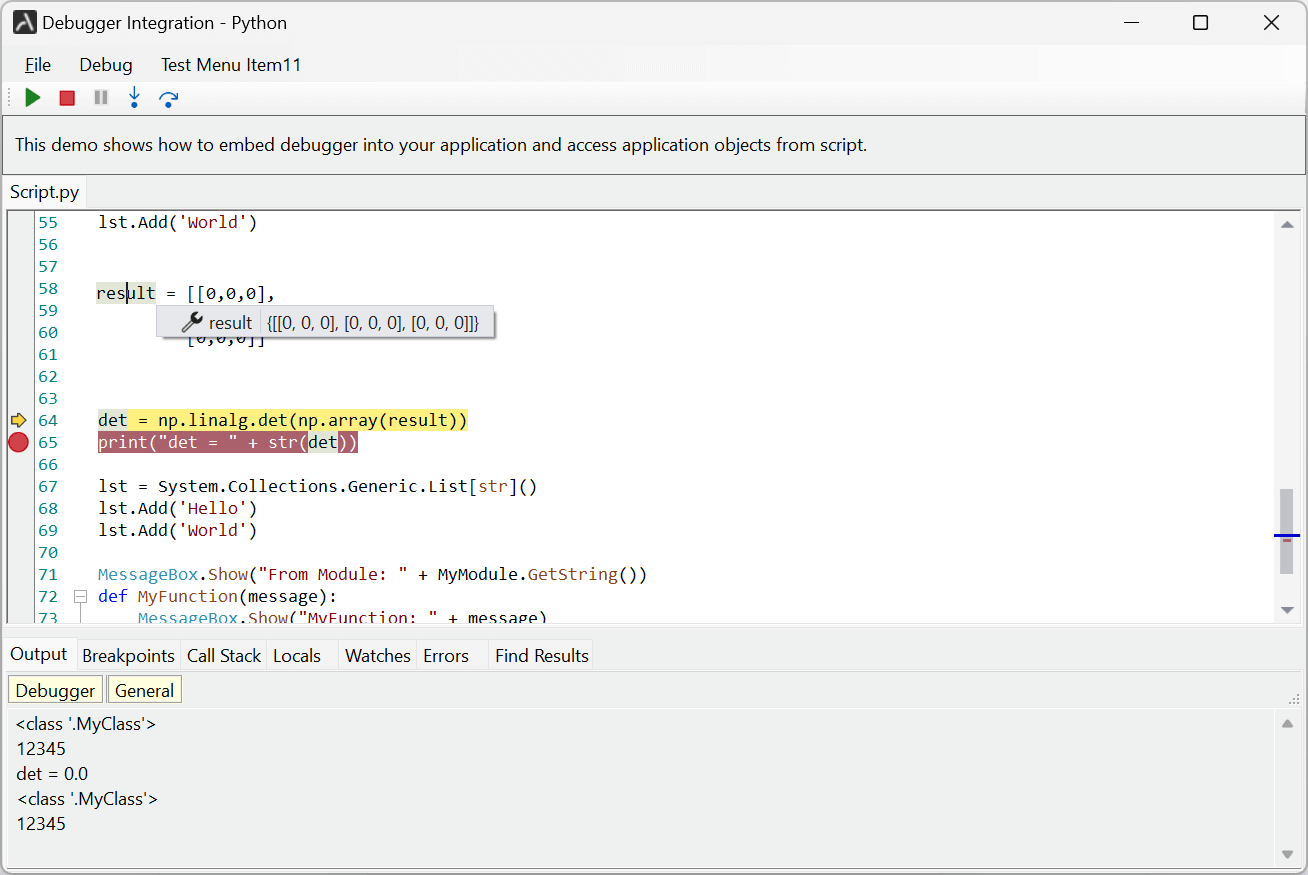
Python and IronPython Scripting and Debugging
AlterNET Scripter supports two Python-based engines, each optimized for specific integration needs:
-
IronPython - Open-source .NET-based Python implementation - allows smooth execution and debugging of Python scripts within the same application process. This approach eliminates most inter-process debugging challenges.
-
Python.NET provides deep interoperability between Python and the .NET Framework. It supports popular libraries such as NumPy, Pandas, and TensorFlow, making it ideal for scientific and data-driven applications. Its main limitations include:
-
Dependency on an installed Python runtime
-
Limited multithreading support
-
Slightly slower startup due to interop overhead
Debugging Features
Both Python engines provide a debugging experience comparable to C# and VB.NET, including breakpoints, step-through execution, and variable inspection. A key advantage of Python-based debugging is that scripts can run and debug in the same process without the restrictions imposed by native code compilation.
However, for both Python engines, script debugging run on a separate thread, so any interaction with UI elements or shared objects must be thread-safe.
See our blog article to read more about Python scripting and debugging.
Code Editing Support
Neither IronPython nor Python.NET includes built-in APIs for code editing. To bridge this gap, we’ve built a custom Python parser that powers our Code Editor, adding features like:
-
Code completion and outlining
-
Error highlighting
-
Intelligent indentation and formatting
This proprietary parser ensures a robust, integrated script editing experience within .NET applications.
See our blog article to read more about our Python parsing.

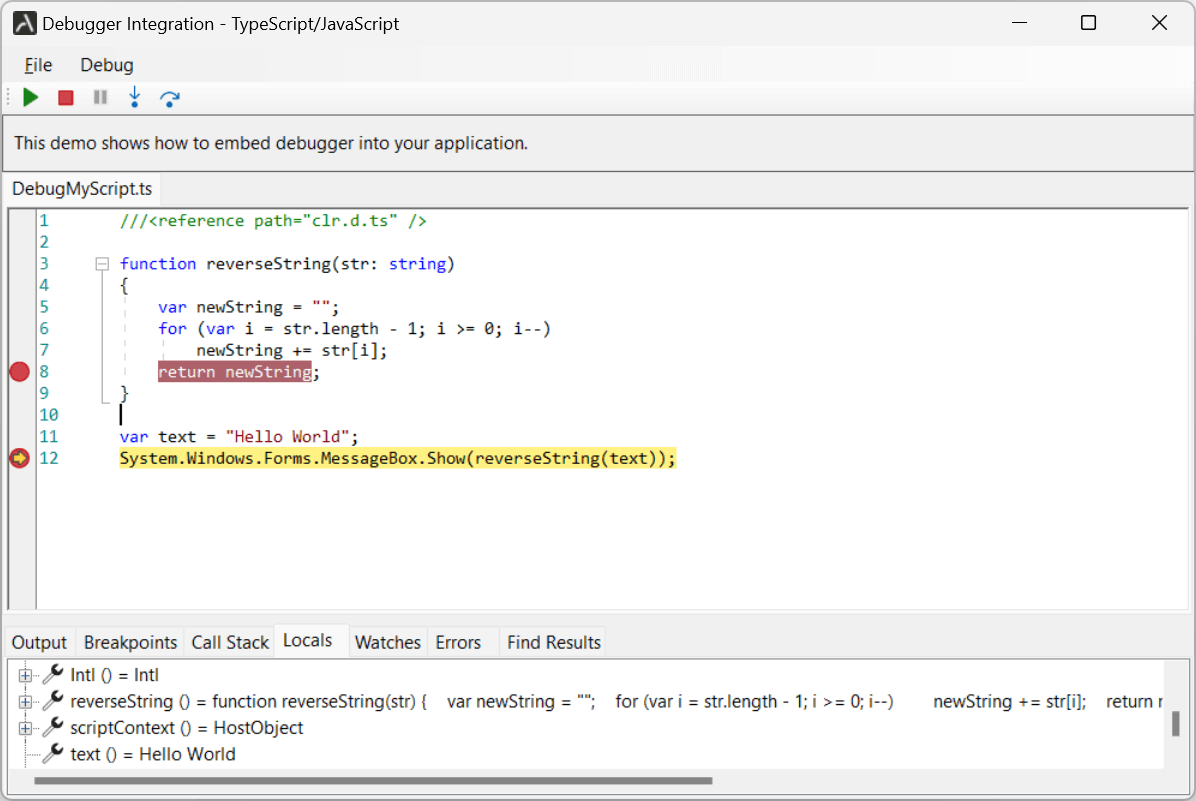
JavaScript and TypeScript Scripting and Debugging
For JavaScript and TypeScript integration, AlterNET Scripter leverages Microsoft ClearScript, providing access to the V8 JavaScript engine.
Execution Flow and Compilation
When running TypeScript, the engine first compiles .ts files to .js and generates type definition files for any referenced .NET assemblies. The first-time compilation may take slightly longer, but subsequent executions are highly optimized.
Debugging Capabilities
Debugging is powered by the Google Chrome DevTools, offering features such as:
-
Step-by-step execution
-
Breakpoint management
-
Watch expressions and call stack inspection
While comprehensive, this engine currently lacks multithreading support and has slightly slower performance compared to Roslyn or IronPython.
Code Editing with TypeScript APIs
TypeScript’s own compiler services API powers our Code Editor integration, delivering Visual Studio Code-like capabilities, including syntax analysis, completion suggestions, and symbol navigation.
Read our blog article to read more about our TypeScript/JavaScript scripting and code editing.

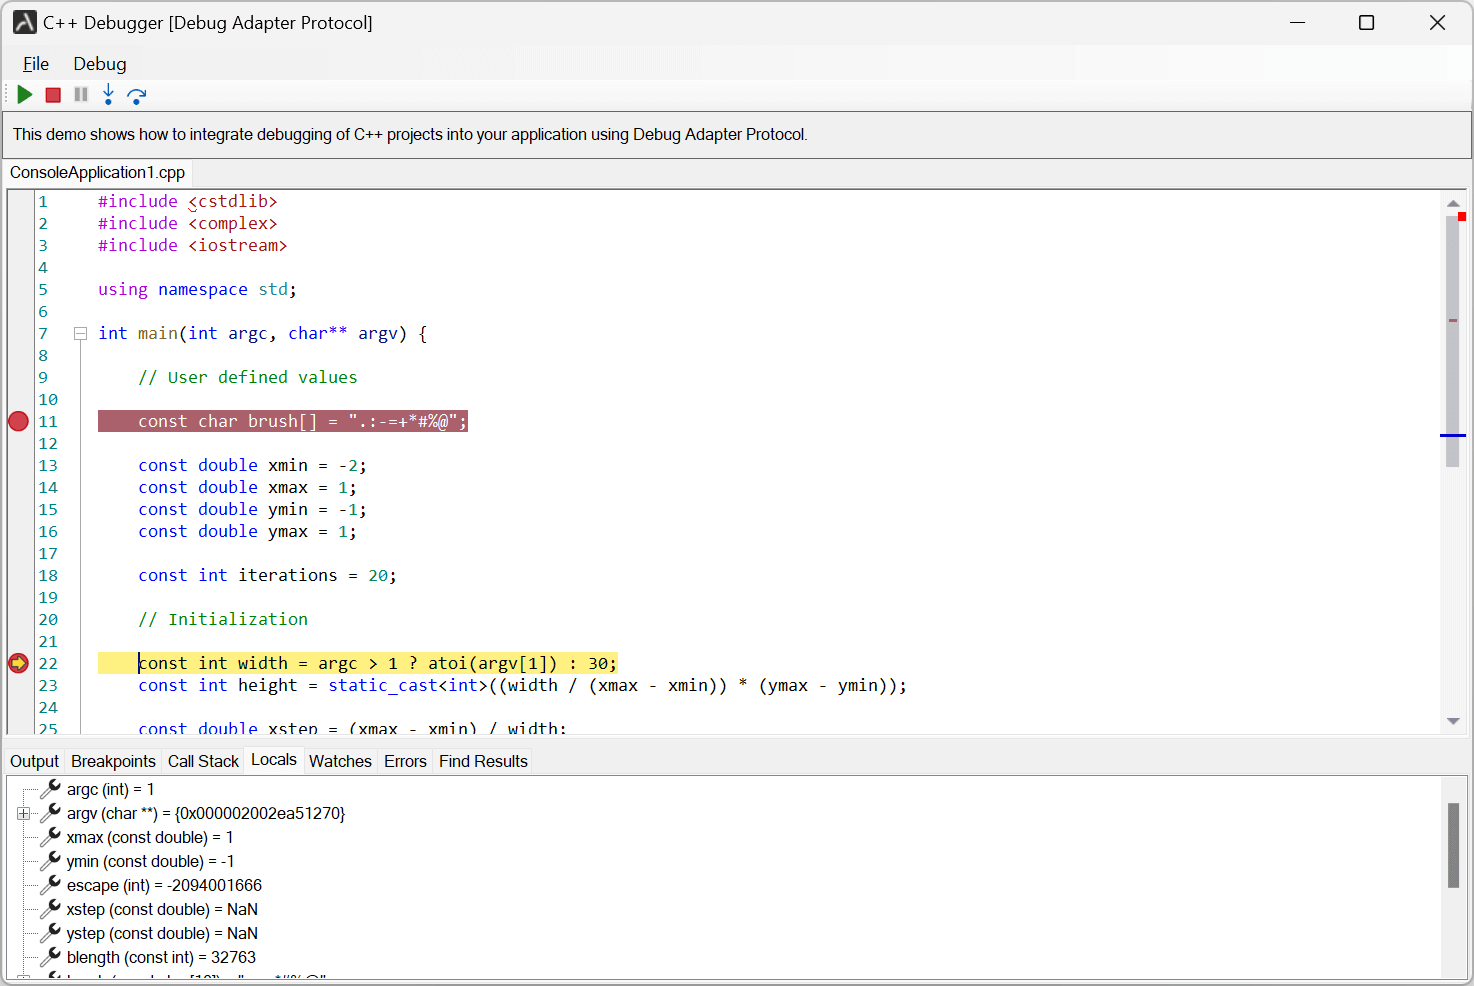
Debugging via Debug Adapter Protocol (DAP)
The Debug Adapter Protocol (DAP) brings universal debugging to AlterNET Scripter. DAP enables consistent communication between editors and debuggers through standardized adapters.
External Tool Dependency
Unlike Roslyn or IronPython, DAP-based debugging requires external tools (e.g., Microsoft’s or third-party debug adapters) to be installed on the target machine. It is best suited for IDE developers creating tools similar to Visual Studio or Eclipse, rather than in-app script debugging.
Integration with Language Server Protocol (LSP)
To complement DAP debugging, AlterNET Scripter integrates Language Server Protocol (LSP) support for intelligent code editing. Together, DAP and LSP deliver a powerful platform for building advanced multi-language IDEs.
Current and Future Implementations
Our current DAP-based integration supports C++ and Python debugging. Future releases will extend this support to other languages, including PowerShell, broadening the scope of AlterNET Scripter’s multi-language debugging environment.
Read our blog article to read more about our supported DAP debuggers.

Summary
Choosing the right scripting and debugging engine for your .NET application depends on the languages you need to support, performance goals, and level of integration required.
With AlterNET Scripter, you can:
-
Embed C#, VB, Python, or JavaScript scripting directly into your app.
-
Offer full debugging capabilities across languages.
-
Enable your users to extend and automate functionality dynamically.
